Predicting the survival of passengers aboard the infamous Titanic has been a classic machine-learning problem. In this blog, I’ll walk through my approach to building a high-accuracy model for Titanic survival prediction, detailing the steps taken for data preprocessing, feature engineering, model building, and evaluation.
1. Project Objective
The objective is to develop a predictive model that accurately determines the survival of passengers based on available features from the Titanic dataset. The ultimate goal is to achieve the highest accuracy on Kaggle's competition leaderboard.
2. Libraries and Tools
To efficiently tackle this problem, I utilized the following libraries:
- pandas: Data manipulation
- seaborn & matplotlib: Data visualization
- scikit-learn: Model training and evaluation
- XGBoost & CatBoost: Advanced classifiers
- Streamlit: Web app deployment
3. Data Exploration and Preprocessing
I began by importing the dataset and performing an Exploratory Data Analysis (EDA) to uncover key insights. Key observations included:
- Passenger class (
Pclass), gender (Sex), and age (Age) strongly influenced survival rates. - Missing values in columns such as
AgeandCabinrequired imputation strategies.
Handling Missing Data
Age: Imputed using median values based on gender and passenger class.Cabin: Dropped due to a high percentage of missing values.
Encoding Categorical Data
Label encoding was applied to categorical features like Sex, Embarked, and Pclass.
4. Model Selection and Evaluation
I evaluated several models, including:
- Logistic Regression
- Random Forest Classifier
- XGBoost
- CatBoost
- Neural Networks
Evaluation Metrics
- Accuracy
- Precision, Recall, and F1-score
- Confusion Matrix
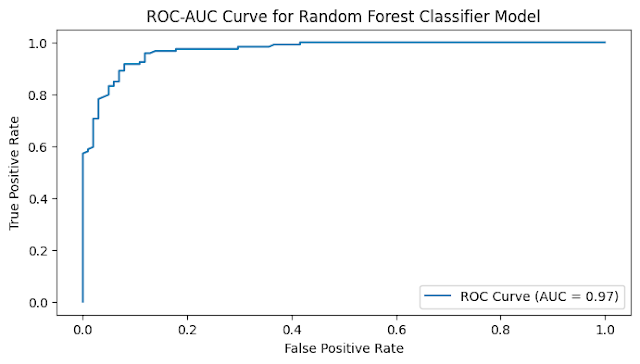
- ROC-AUC Curves
Insights
- Metrics Comparison for Different Models
- Confusion Matrices
- ROC-AUC
Key Results
The highest accuracy was achieved with the following model configuration:
- Model: Tunned Random Forest
- Accuracy: 90.9 %
5. Kaggle Submission and Results
Upon submitting the predictions to Kaggle, I achieved a respectable prediction score of 0.77, demonstrating the effectiveness of the model in classifying survival outcomes.
6. Visualizations
To better understand the model's performance, confusion matrices, ROC-AUC curves, and feature importances were visualized. Below are key plots:
- Confusion Matrix
- ROC-AUC Curve
7. Streamlit App Deployment
The project was further enhanced by deploying a Streamlit app, making it accessible for real-time predictions. Check out the live app here.
8. Conclusion
This project provided valuable insights into the predictive factors for Titanic survival. Building and evaluating various models helped fine-tune the prediction strategy, ultimately leading to an optimized solution.


